Designing a TCO or ROI Calculator for a SaaS Website
How to design a TCO or ROI calculator for a B2B SaaS website: selection-based inputs, instant results, honest assumptions, and a detailed report as the lead capture.
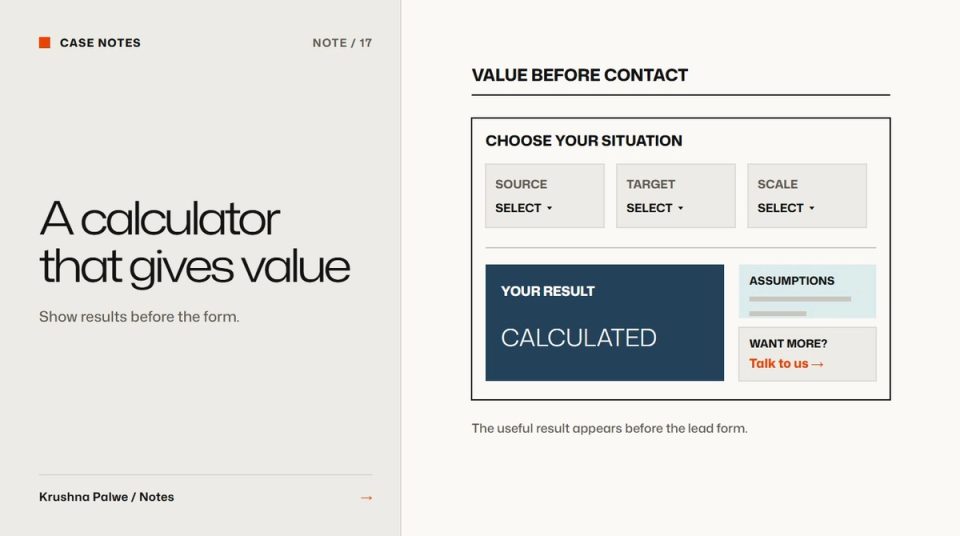
Most SaaS calculators are lead forms wearing a disguise. The visitor enters six numbers, presses a button, and is asked for an email before seeing anything. Enterprise buyers recognise the pattern and leave. SaaS TCO calculator design works when the tool gives value first and asks for contact details only when the visitor wants more.
I designed and built a total cost of ownership calculator for Datamotive, a cloud migration and disaster recovery company. It was built as a lead converter rather than a price list: a buyer picks their source platform, target and scale, and sees their own numbers before anyone asks for an email. These are the decisions that shaped it.
Decide what the calculator is for
Write one sentence before designing any screen. For a tool like Datamotive's it reads something like: help an IT team see how their recovery costs compare over one to three years, so they have a reason to talk to sales. That sentence settles a lot:
- The output is a comparison, not a quote.
- The time frame is one to three years, a horizon infrastructure budgets are commonly planned over.
- The audience is technical and financial at once, so the result must be clear to both.
If the calculator is meant to qualify leads, say so internally. If it is meant to educate, say that. Trying to do both without deciding usually produces a long form that does neither well.
Use selections instead of open inputs
Free-text number fields create friction and errors. Most buyers do not know their exact figures, and they do not want to guess in front of a vendor. Datamotive's calculator uses selection-based inputs:
- Source platform, chosen from the environments the product supports.
- Target, such as a public cloud or on-premises recovery site.
- Scale, chosen rather than typed as an exact count.
Selections do three things. They are fast on a phone. They keep inputs within ranges the model can handle. And they quietly educate the visitor about what the product supports.
Keep the number of inputs small. Each extra question loses people. If a factor barely changes the result, use a sensible default and show it as an assumption instead of asking.
Show results instantly
The result should update as the visitor changes inputs. A "calculate" button adds a step and hides the relationship between choice and outcome. Instant feedback lets people explore: what if we recover to a different target, or at a larger scale?
Datamotive's result is an instant one-to-three-year comparison. Design the result for a quick read:
- One headline figure answering the question in the purpose sentence.
- A simple comparison across the years, as bars or a small table.
- A short explanation of what drives the difference.
Use the same colour roles and chart style as the rest of the website. A calculator that looks like an embedded third-party widget feels less trustworthy, even if the maths is identical.
Make the assumptions visible
Enterprise buyers check numbers. If they cannot see how a figure was produced, they discount it. Show the assumptions behind the result in plain language, close to the result, with a way to expand for detail. Label estimates as estimates.
Avoid inflated defaults that make the product look better than a buyer's real situation. A cloud architect who spots one unrealistic assumption will distrust the whole tool and the website around it. The same principle runs through trust signals for enterprise SaaS websites.
Put the lead capture where the visitor wants more
At Datamotive the detailed report is the lead capture. The visitor already has a useful answer on screen. The report adds what a buyer would want to take into an internal discussion: a fuller breakdown they can share. Asking for an email at that point is an exchange the visitor understands.
Keep the form short. Name, work email and company is usually enough. Explain what happens next in one line, such as when the report arrives and whether someone will follow up.
Design for both readers
A TCO result is read by two people: the technical evaluator who ran the calculator and the finance or leadership person they forward it to. Design the result and the report so the second reader understands it without the first one explaining it:
- A headline sentence a non-technical reader can repeat.
- Figures with units and time frames always attached.
- A short list of what is included and what is not.
Treat it as part of the system
The calculator is a product surface, not a campaign asset. Build it from the same tokens, type ramp and components as the site so it stays consistent as the brand evolves. At Datamotive the whole website was built in React and Tailwind on the same token system as the brand, so the calculator inherits colour, type and spacing rather than carrying its own. Design token naming explains how one name can carry a decision from Figma into CSS.
Place entry points to the calculator where cost questions naturally arise: pricing-related pages, product pages and late-stage CTAs. B2B CTA design covers how to phrase those entry points for different buyer stages.
A review checklist
- Can a visitor see a useful result without giving an email?
- Are there five inputs or fewer, mostly selections?
- Does the result update instantly?
- Are assumptions visible and labelled as estimates?
- Does the report offer something genuinely more useful than the screen?
- Does the result make sense to someone who did not run the calculator?
- Does it look and behave like the rest of the site?
You can see the TCO calculator and the system it was built on in the Datamotive case study.