How to Explain a Complex B2B SaaS Product Visually
A practical visual sequence for explaining complex B2B SaaS products with proof, workflows, screenshots, and diagrams that buyers can follow.
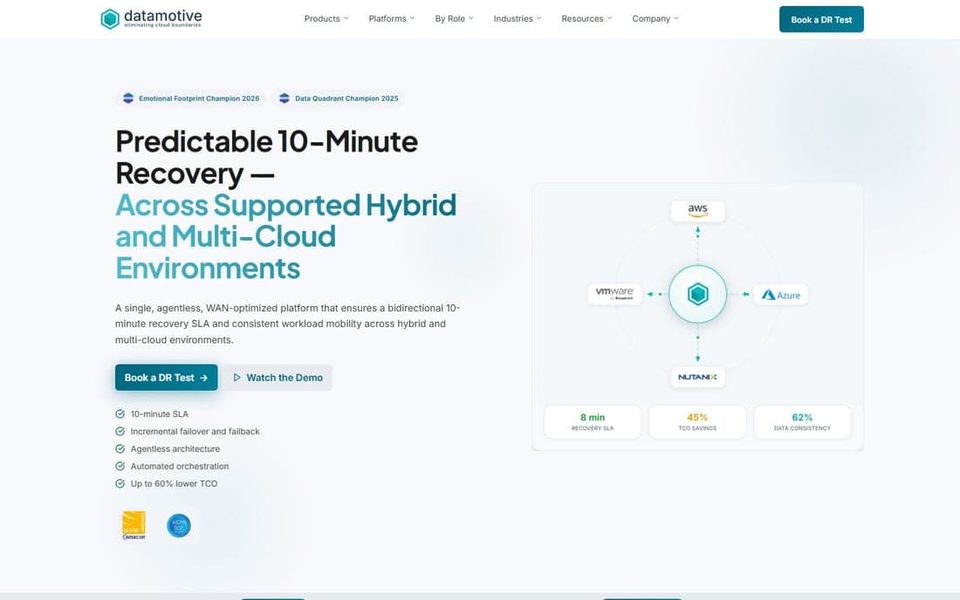
When a SaaS product is technically complicated, the first visual-design problem is not decoration. It is sequence. A buyer needs to understand what the product changes, how it works, and why the company can be trusted before a detailed interface screenshot becomes useful.
I use a simple test: after the first screen, can a new reader explain the problem in their own words? After the next section, can they describe the product workflow? If the answer is no, adding more features or more animation will make the page busier, not clearer.
Start with the buyer's before and after
The first job is to state the change in the buyer's world. Do not start with a product noun such as platform, engine, or control plane. Start with the condition the buyer wants to change: a migration that takes too long, recovery steps that are hard to coordinate, or a risk that is expensive to explain internally.
At Datamotive, the product family covered cloud migration and disaster recovery. The visual system worked because the page gave each product a distinct job while retaining one company-level structure. That is different from giving every feature its own visual treatment.
Use this opening sequence:
- Name the operational problem in language the buyer already uses.
- Show the outcome in one sentence.
- Introduce the product as the mechanism, not as the hero noun.
- Offer one piece of evidence that makes the claim inspectable.
This sequence also makes a useful distinction between a marketing promise and a product explanation. The promise earns attention. The explanation earns belief.
Choose the visual format for the question
Screenshots, diagrams, and animation solve different comprehension problems.
Use a screenshot when the buyer needs to judge what they will actually operate. Crop it to the task, add only the labels that remove ambiguity, and preserve enough surrounding context to show that the state is real.
Use a diagram when the buyer needs to understand relationships: source to destination, product to service, or failure to recovery. A diagram should answer one question. If it needs a paragraph to explain what each arrow means, the visual language is not doing enough work.
Use animation when time or state change is the hard part. Motion can show a migration progressing or a failover sequence unfolding, but it should not be the only way to understand the product. A still frame and a short label should carry the core explanation.
I keep a decision rule close to the brief: screenshot for operation, diagram for relationship, motion for change. When a section needs all three, they should appear in that order rather than competing in one hero composition.
Give technical detail a reading order
Technical buyers do not reject detail. They reject detail without hierarchy. A useful diagram has three layers:
- The headline layer names the business or operational outcome.
- The structure layer shows the main systems and relationships.
- The verification layer gives labels, states, or constraints for readers who need to inspect the claim.
The first layer should work at a glance. The second should work at normal reading size. The third can reward zooming or a deeper page section. This is why consistent line weights, label placement, and color roles matter more than adding visual effects.
In the Datamotive case study, the same visual grammar carries product pages, diagrams, and the wider website. That consistency reduces the amount of interpretation a buyer has to do from section to section.
Replace feature piles with proof paths
A feature list asks the reader to remember. A proof path lets the reader verify.
For each important claim, ask four questions:
- What is the claim?
- What would a skeptical buyer need to see?
- Which visual can show it without exaggeration?
- Where should the reader go next if they need more detail?
For example, a claim about recovery can lead to a diagram of the recovery flow, a product view showing the relevant state, and a case-study section that explains the design decision. The internal link is part of the explanation, not a last-minute SEO addition.
A review checklist for SaaS visuals
Before shipping, I review the page in this order:
- Can a non-specialist name the problem after the first section?
- Does every visual have one primary question?
- Are screenshots showing a meaningful state rather than a decorative crop?
- Do diagrams use one legend, one line-weight logic, and one label pattern?
- Can the page be understood with motion disabled?
- Is the proof close enough to the claim to be credible?
- Does the next link take the reader to a deeper explanation or a relevant case study?
The goal is not to make complex software look simple. The goal is to make its complexity legible. That is the visual-design work behind a stronger SaaS website design system, and it is why a portfolio case study should show the reasoning behind the interface, not only the final screens.
Related reading: a marketing design system for a small B2B SaaS team and how to build a diagram system for a complex product.